The happiest cities in America in 2026, ranked across 11 factors
Posted
Jaclyn DeJohn, CFP for SmartAsset
The happiest cities in America in 2026, ranked across 11 factors
Happiness may not be easy to quantify, but some qualifiers may make a person more likely to feel satisfied in life. A reasonable degree of financial freedom can alleviate worry about day-to-day costs and the occasional unexpected expense. Similarly, good relationships, overall health and longevity, basic conveniences, and privacy can go a long way in keeping stress down and contentment up. While none of these things alone are the secret to happiness, they may all individually contribute to a life geared toward wants rather than needs — freeing up time and resources for individuals to explore and build a life on their own terms.
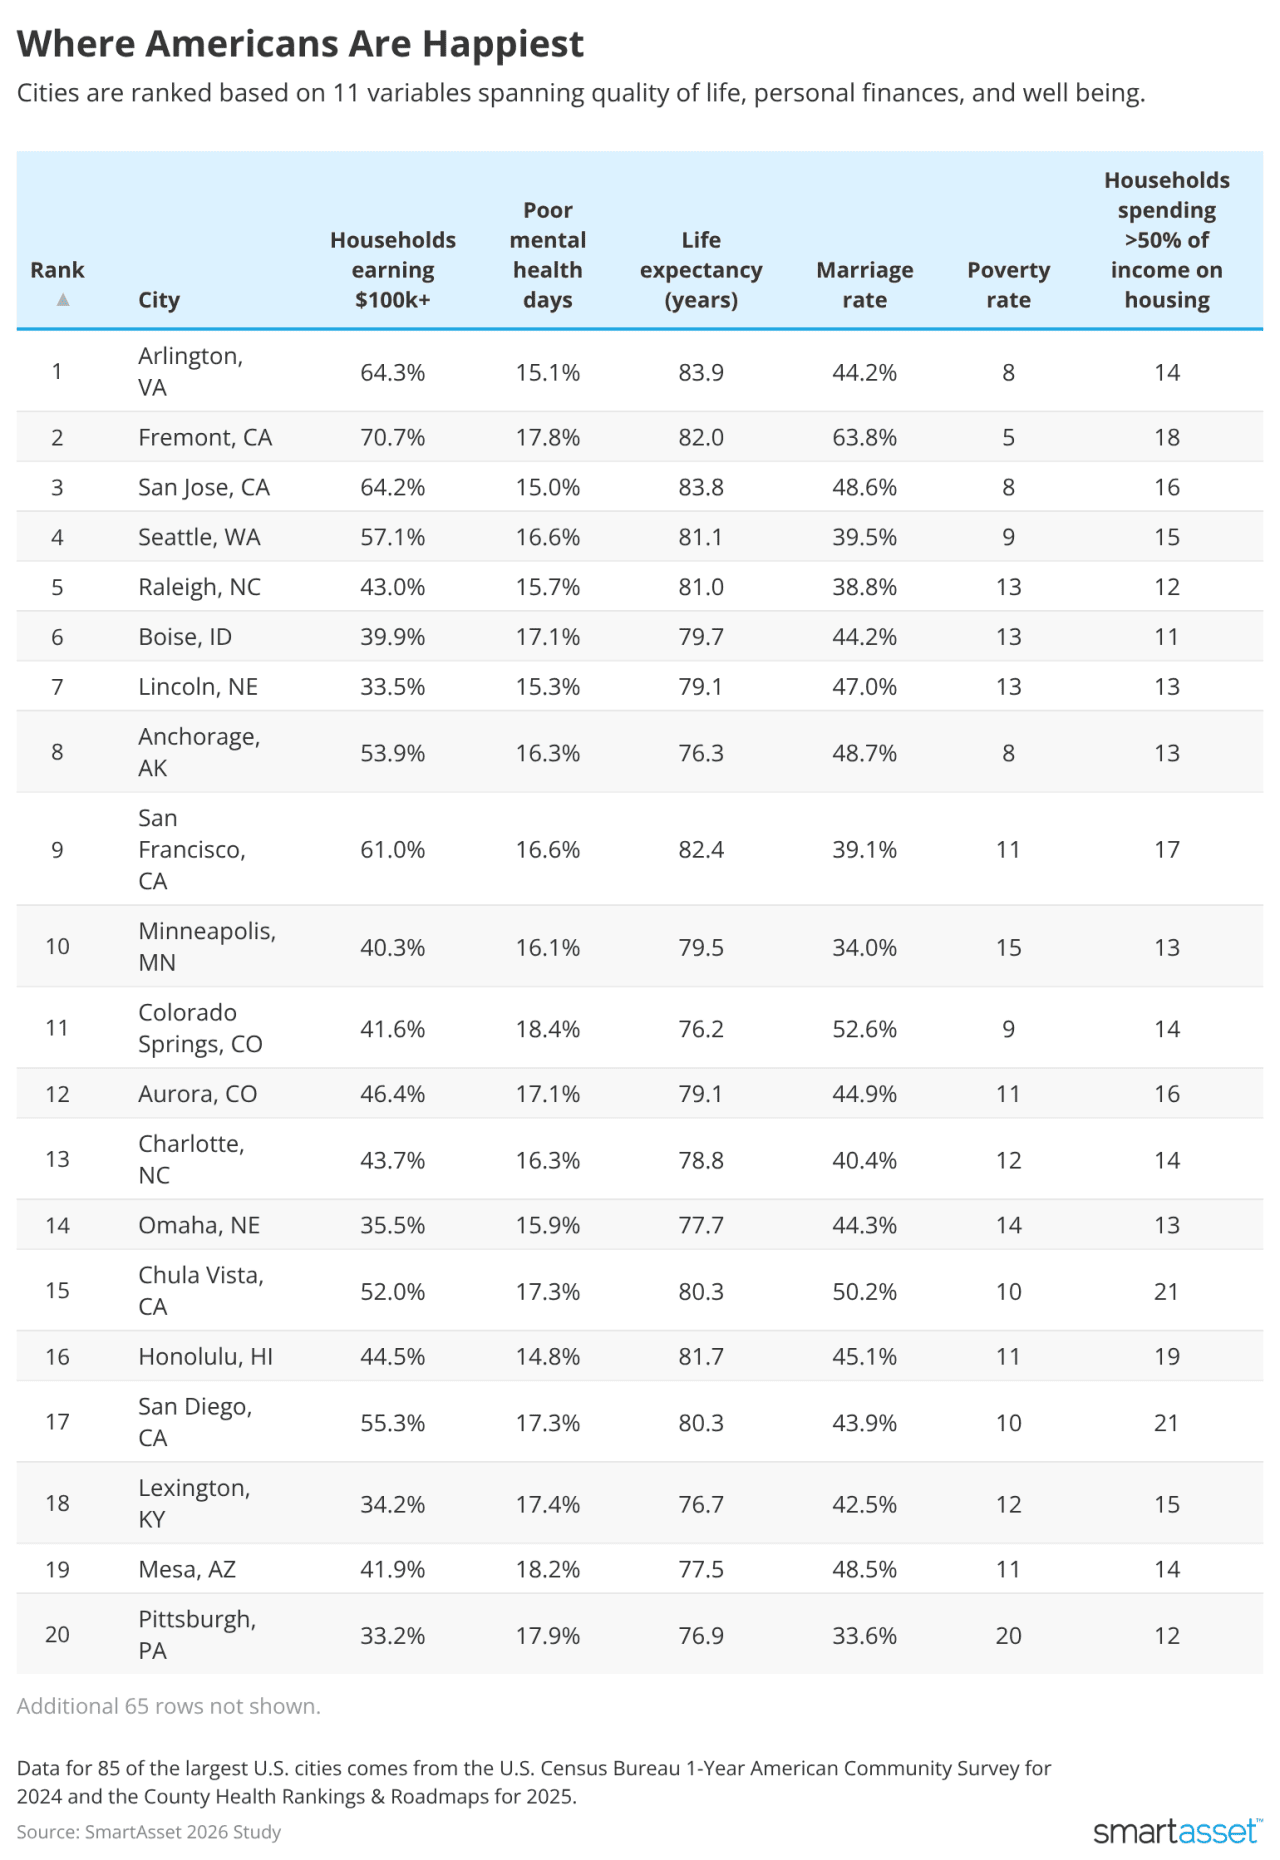
With this in mind, SmartAsset ranked 85 of the largest U.S. cities with available data based on 11 happiness factors spanning personal finance, physical and mental well-being, and quality of life factors.
Key Findings
Arlington, VA, ranks as the happiest city for 2026. Arlington ranks among the top five cities for a variety of happiness metrics, including life expectancy (83.9 years), household earnings over $100,000 (64.3%), mentally healthy days (84.9%), adults getting exercise (83%), and access to activity spaces (100%).
Fremont, CA, households outearn their peers. Ranking second overall for happiest cities, 70.7% of Fremont households earn over $100,000, the most studywide. This pairs with the lowest poverty rate of 4.7%. However, 18.1% of households in Fremont end up spending 50% or more of their income on housing. In tandem, the population maintains the highest rate of health insurance coverage and marriage, at 98.1% and 63.8%, respectively.
Austin, TX, has the least traffic. The traffic volume per meter in Austin, Texas — a practice ground for many autonomous vehicle companies — is lowest studywide at 42.1. This pales in comparison to Boston, which has over 40 times the traffic volume per meter at 1753.9. The average traffic volume per meter is 299.
Residents have the most mentally healthy days in Honolulu. Ranking 16th happiest overall, Honolulu residents feel mentally healthy for 85.2% of days. San Jose, California, follows closely at 85% mentally healthy days. On the other end of the spectrum, the residents of Toledo, Ohio, have the worst mental health ranking, at 78.2% of days spent mentally healthy.
These California cities have the most overcrowding in housing. Privacy and space can go a long way in making a person comfortable in their own space, and can be indicative of financial resources. In Long Beach, Los Angeles, and Fresno, just over 10% of households are home to more than one person per bedroom. Laredo, Texas, also falls into this category of high overcrowding. Meanwhile, Pittsburgh has the lowest rate of overcrowding at 0.9%.
SmartAsset
Top 25 Happiest Cities
Arlington, VA
Households earning $100k+: 64.3%
Poverty rate: 8.3%
Households spending >50% of income on housing: 14.2%
Poor mental health days: 15.1%
Life expectancy (years): 83.9
Percent of adults getting exercise: 83%
Population with health insurance: 93.9%
Marriage rate: 44.2%
Traffic volume per meter: 540
Access to activity space: 100%
Overcrowded households: 3.4%
Fremont, CA
Households earning $100k+: 70.7%
Poverty rate: 4.7%
Households spending >50% of income on housing: 18.1%
Poor mental health days: 17.8%
Life expectancy (years): 82
Percent of adults getting exercise: 81.2%
Population with health insurance: 98.1%
Marriage rate: 63.8%
Traffic volume per meter: 683
Access to activity space: 99.6%
Overcrowded households: 7.7%
San Jose, CA
Households earning $100k+: 64.2%
Poverty rate: 8.1%
Households spending >50% of income on housing: 15.7%
Poor mental health days: 15%
Life expectancy (years): 83.8
Percent of adults getting exercise: 80.9%
Population with health insurance: 95.6%
Marriage rate: 48.6%
Traffic volume per meter: 626.4
Access to activity space: 99.4%
Overcrowded households: 7.9%
Seattle, WA
Households earning $100k+: 57.1%
Poverty rate: 9.4%
Households spending >50% of income on housing: 15%
Poor mental health days: 16.6%
Life expectancy (years): 81.1
Percent of adults getting exercise: 86.7%
Population with health insurance: 96.3%
Marriage rate: 39.5%
Traffic volume per meter: 333
Access to activity space: 97.9%
Overcrowded households: 3.9%
Raleigh, NC
Households earning $100k+: 43%
Poverty rate: 13.3%
Households spending >50% of income on housing: 12%
Poor mental health days: 15.7%
Life expectancy (years): 81
Percent of adults getting exercise: 84.2%
Population with health insurance: 92.9%
Marriage rate: 38.8%
Traffic volume per meter: 111.6
Access to activity space: 98.6%
Overcrowded households: 2%
Boise, ID
Households earning $100k+: 39.9%
Poverty rate: 12.9%
Households spending >50% of income on housing: 10.9%
Poor mental health days: 17.1%
Life expectancy (years): 79.7
Percent of adults getting exercise: 82.4%
Population with health insurance: 93.1%
Marriage rate: 44.2%
Traffic volume per meter: 116.7
Access to activity space: 91.6%
Overcrowded households: 1.9%
Lincoln, NE
Households earning $100k+: 33.5%
Poverty rate: 13.4%
Households spending >50% of income on housing: 12.6%
Poor mental health days: 15.3%
Life expectancy (years): 79.1
Percent of adults getting exercise: 78.9%
Population with health insurance: 93.4%
Marriage rate: 47%
Traffic volume per meter: 211.1
Access to activity space: 95.4%
Overcrowded households: 2.2%
Anchorage, AK
Households earning $100k+: 53.9%
Poverty rate: 8.3%
Households spending >50% of income on housing: 13.2%
Poor mental health days: 16.3%
Life expectancy (years): 76.3
Percent of adults getting exercise: 80.1%
Population with health insurance: 90.6%
Marriage rate: 48.7%
Traffic volume per meter: 152.3
Access to activity space: 93.9%
Overcrowded households: 4.5%
San Francisco, CA
Households earning $100k+: 61%
Poverty rate: 11.3%
Households spending >50% of income on housing: 16.9%
Poor mental health days: 16.6%
Life expectancy (years): 82.4
Percent of adults getting exercise: 83.6%
Population with health insurance: 97.2%
Marriage rate: 39.1%
Traffic volume per meter: 794
Access to activity space: 100%
Overcrowded households: 6.8%
Minneapolis, MN
Households earning $100k+: 40.3%
Poverty rate: 15.1%
Households spending >50% of income on housing: 13.4%
Poor mental health days: 16.1%
Life expectancy (years): 79.5
Percent of adults getting exercise: 83.3%
Population with health insurance: 94.3%
Marriage rate: 34%
Traffic volume per meter: 304.6
Access to activity space: 99.1%
Overcrowded households: 2.7%
Colorado Springs, CO
Households earning $100k+: 41.6%
Poverty rate: 8.8%
Households spending >50% of income on housing: 14.4%
Poor mental health days: 18.4%
Life expectancy (years): 76.2
Percent of adults getting exercise: 81.5%
Population with health insurance: 91.5%
Marriage rate: 52.6%
Traffic volume per meter: 140.9
Access to activity space: 89.8%
Overcrowded households: 2.5%
Aurora, CO
Households earning $100k+: 46.4%
Poverty rate: 10.7%
Households spending >50% of income on housing: 15.6%
Poor mental health days: 17.1%
Life expectancy (years): 79.1
Percent of adults getting exercise: 82.4%
Population with health insurance: 85.6%
Marriage rate: 44.9%
Traffic volume per meter: 215.2
Access to activity space: 97.5%
Overcrowded households: 3%
Charlotte, NC
Households earning $100k+: 43.7%
Poverty rate: 11.9%
Households spending >50% of income on housing: 14.3%
Poor mental health days: 16.3%
Life expectancy (years): 78.8
Percent of adults getting exercise: 81.1%
Population with health insurance: 87.9%
Marriage rate: 40.4%
Traffic volume per meter: 165.5
Access to activity space: 88.7%
Overcrowded households: 2.3%
Omaha, NE
Households earning $100k+: 35.5%
Poverty rate: 14.2%
Households spending >50% of income on housing: 13.1%
Poor mental health days: 15.9%
Life expectancy (years): 77.7
Percent of adults getting exercise: 75.7%
Population with health insurance: 91.2%
Marriage rate: 44.3%
Traffic volume per meter: 214.9
Access to activity space: 97.4%
Overcrowded households: 2.1%
Chula Vista, CA
Households earning $100k+: 52%
Poverty rate: 9.6%
Households spending >50% of income on housing: 20.8%
Poor mental health days: 17.3%
Life expectancy (years): 80.3
Percent of adults getting exercise: 81.7%
Population with health insurance: 94.8%
Marriage rate: 50.2%
Traffic volume per meter: 440.1
Access to activity space: 97.5%
Overcrowded households: 6.9%
Honolulu, HI
Households earning $100k+: 44.5%
Poverty rate: 10.5%
Households spending >50% of income on housing: 19.4%
Poor mental health days: 14.8%
Life expectancy (years): 81.7
Percent of adults getting exercise: 77.8%
Population with health insurance: 96.8%
Marriage rate: 45.1%
Traffic volume per meter: 536.2
Access to activity space: 96.6%
Overcrowded households: 8.7%
San Diego, CA
Households earning $100k+: 55.3%
Poverty rate: 10.4%
Households spending >50% of income on housing: 20.8%
Poor mental health days: 17.3%
Life expectancy (years): 80.3
Percent of adults getting exercise: 81.7%
Population with health insurance: 94.3%
Marriage rate: 43.9%
Traffic volume per meter: 440.1
Access to activity space: 97.5%
Overcrowded households: 6.9%
Lexington, KY
Households earning $100k+: 34.2%
Poverty rate: 12.1%
Households spending >50% of income on housing: 14.7%
Poor mental health days: 17.4%
Life expectancy (years): 76.7
Percent of adults getting exercise: 77.1%
Population with health insurance: 91.9%
Marriage rate: 42.5%
Traffic volume per meter: 163.7
Access to activity space: 97.4%
Overcrowded households: 2.2%
Mesa, AZ
Households earning $100k+: 41.9%
Poverty rate: 10.8%
Households spending >50% of income on housing: 14.2%
Poor mental health days: 18.2%
Life expectancy (years): 77.5
Percent of adults getting exercise: 78%
Population with health insurance: 89%
Marriage rate: 48.5%
Traffic volume per meter: 244.2
Access to activity space: 92.8%
Overcrowded households: 4.4%
Pittsburgh, PA
Households earning $100k+: 33.2%
Poverty rate: 20.1%
Households spending >50% of income on housing: 11.9%
Poor mental health days: 17.9%
Life expectancy (years): 76.9
Percent of adults getting exercise: 79%
Population with health insurance: 96%
Marriage rate: 33.6%
Traffic volume per meter: 202.3
Access to activity space: 93.3%
Overcrowded households: 0.9%
Denver, CO
Households earning $100k+: 46.8%
Poverty rate: 12.1%
Households spending >50% of income on housing: 16.3%
Poor mental health days: 18.3%
Life expectancy (years): 77.4
Percent of adults getting exercise: 78.8%
Population with health insurance: 90.7%
Marriage rate: 40.5%
Traffic volume per meter: 415.7
Access to activity space: 99.1%
Overcrowded households: 3.1%
Oakland, CA
Households earning $100k+: 51.2%
Poverty rate: 11.9%
Households spending >50% of income on housing: 18.1%
Poor mental health days: 17.8%
Life expectancy (years): 82
Percent of adults getting exercise: 81.2%
Population with health insurance: 94.1%
Marriage rate: 38.3%
Traffic volume per meter: 683
Access to activity space: 99.6%
Overcrowded households: 7.7%
Spokane, WA
Households earning $100k+: 38.4%
Poverty rate: 12.7%
Households spending >50% of income on housing: 13.9%
Poor mental health days: 19.9%
Life expectancy (years): 76.9
Percent of adults getting exercise: 79.6%
Population with health insurance: 93.7%
Marriage rate: 41.9%
Traffic volume per meter: 150.4
Access to activity space: 87.6%
Overcrowded households: 2.1%
Atlanta, GA
Households earning $100k+: 45.4%
Poverty rate: 15.8%
Households spending >50% of income on housing: 17.3%
Poor mental health days: 15.9%
Life expectancy (years): 77.5
Percent of adults getting exercise: 80%
Population with health insurance: 91.4%
Marriage rate: 31.8%
Traffic volume per meter: 384
Access to activity space: 93.8%
Overcrowded households: 2%
Henderson, NV
Households earning $100k+: 48.3%
Poverty rate: 8.8%
Households spending >50% of income on housing: 18.5%
Poor mental health days: 18.4%
Life expectancy (years): 76.6
Percent of adults getting exercise: 73%
Population with health insurance: 94.2%
Marriage rate: 48%
Traffic volume per meter: 196.6
Access to activity space: 95.7%
Overcrowded households: 4.4%
Data and Methodology
Eighty-five of the largest U.S. cities for which data was available were evaluated across three categories: personal finance, well-being, and quality of life. Data comes from the U.S. Census Bureau 1-Year American Community Survey for 2024 and the County Health Rankings & Roadmaps for 2025.